What is a tank farm? Defining the fence line for a storage read
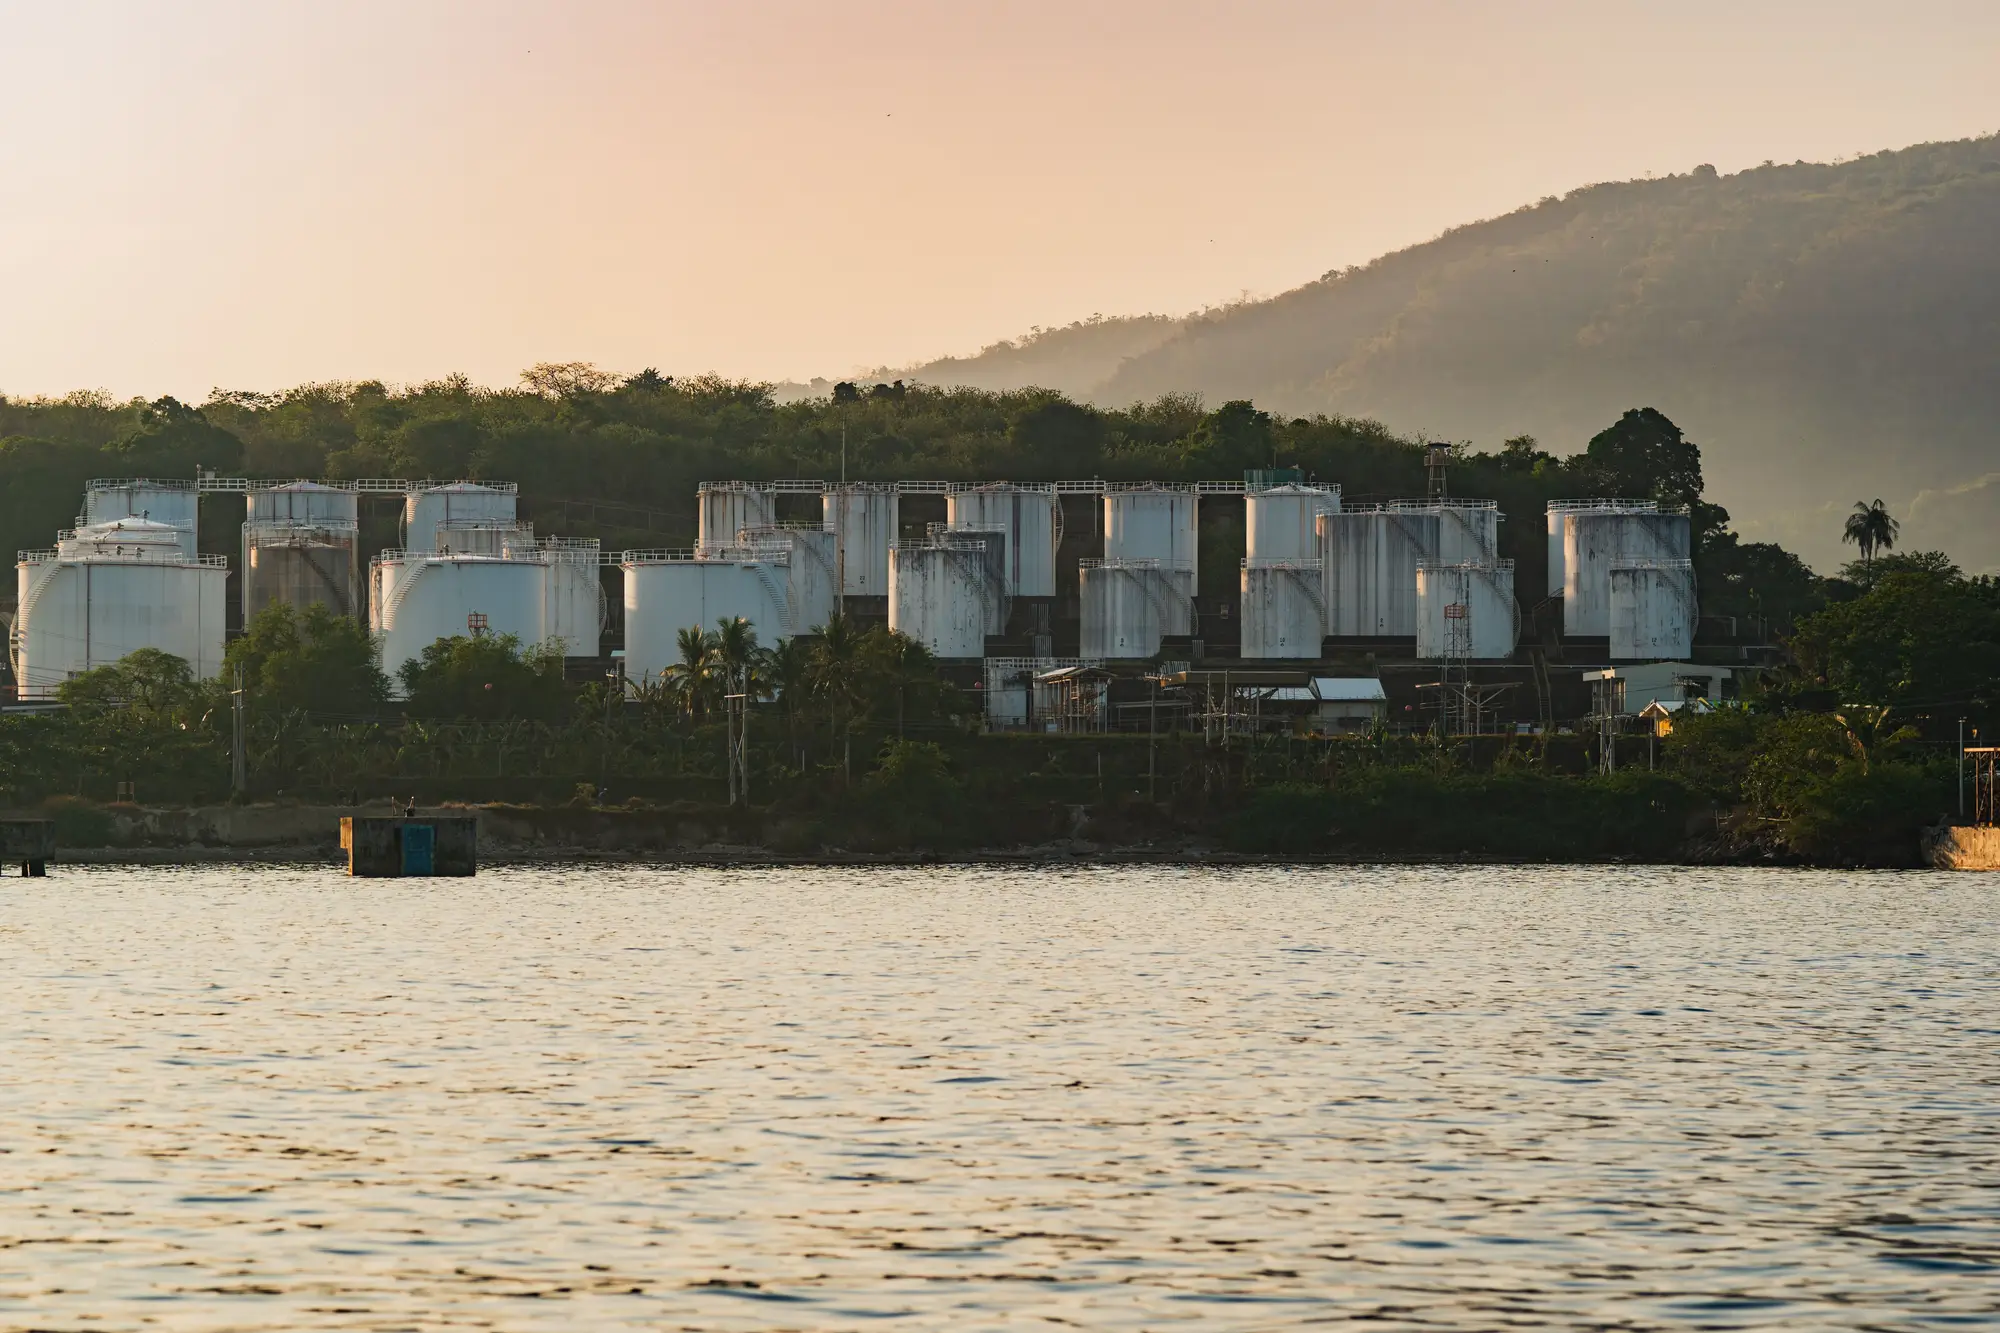
Ask three analysts to define "tank farm" and you'll get three slightly different answers, and all three will be defensible. The term gets used loosely in market commentary, which is fine for a headline but not fine when you're trying to pull a storage read that someone else can reproduce. If your boundary doesn't match the next analyst's boundary, your numbers won't match either, even if both of you are looking at the same patch of ground.
Tank farm vs single storage tank
A single storage tank is exactly that: one vessel, usually tied to a specific process unit, a refinery's crude feed, or a captive contract. Nobody calls one tank a tank farm.
A tank farm is a cluster of tanks, usually six or more, under common ownership or common operation, sharing pipeline connections, pump stations, and often a single fenced perimeter. The tanks inside don't all hold the same grade or even the same product. A farm might mix crude, intermediate feedstocks, and finished product in adjacent tanks, which is one reason a raw tank count from satellite imagery can mislead you if you don't know what's stored where.
A single tank's fill level is one data point. A tank farm's aggregate fill level, tracked over time, is what traders actually use as a proxy for how much crude or product in a given area is sitting still versus moving.
Where the fence line sits
Here's where it gets messier than the word "farm" suggests. Big storage hubs like Cushing, the ARA cluster, or Fujairah aren't one tank farm with one owner. They're a patch of geography containing several tank farms, each belonging to a different midstream company or trading house, each with its own fence line, its own access road, and its own pipeline tie-ins.
When a weekly inventory report cites "Cushing stocks," it's reporting an aggregate across every farm inside that hub, built from operator-submitted data with a lag built in. When you're doing your own monitoring, you get to choose a narrower boundary: one operator's farm, a handful of farms along a particular pipeline corridor, or the full hub if that's what you're trying to approximate.
The practical rule most analysts land on: draw the boundary around the tanks you can consistently identify and re-identify from one satellite pass to the next. A fence line, a shared access road, and a cluster of floating-roof tanks sitting close enough together to share a pump station make a workable unit. If a single company operates two physically separate clusters ten miles apart, treat them as two farms for monitoring purposes, even if the company reports them as one asset internally. Your read should follow what you can see and count consistently, week after week; a corporate org chart doesn't enter into it.
Why the boundary matters for a storage read
Get the boundary wrong and you get drift. If you redraw the edge of what counts, your tank count can jump from one month to the next even though nothing physically changed inside the fence. Drop a few tanks because they sit just outside where you drew the line last time, and you've manufactured a production draw that never happened.
This is also where floating-roof tanks matter most. Fixed-roof tanks give you a silhouette and not much else from overhead; you can't read a fill level off a flat lid. A floating-roof tank's deck sits right on the oil surface, and as the level drops, the deck drops with it, casting a shadow whose length shows how far down it has gone. That's the geometry behind a daily storage read. A consistent fence line applied to a consistent set of these tanks is what turns a one-off satellite pass into a usable time series.
If you're drawing that boundary by hand, tank by tank, every week, it's slow work and the drift creeps in regardless of how careful you are. Oil Tank Fill reads the shadow geometry of every visible floating-roof tank inside a fixed area you define, daily, so the boundary stays the same from one read to the next. Set your fence line once and let the read come to you before the next report lands.